Cancer companies usually accompany data readouts, conference posters or presentations with various types of graphs and plots to represent the outcomes. This note will go over what each means and their significance.
WaterfallPlot
In a waterfall plot, each patient is vertically represented as an individual bar. The y axis displays the maximum percentage change from baseline in tumor measurement (ie best overall response). The data is displayed in a descending order and gives the appearance of a waterfall, hence the name. It sorts the results from worst response to the best response.
A waterfall plot shows a snapshot of a patient’s best overall response to treatment in the clinical trial. Keep in mind that waterfall plots show 'static' information since only the best response is reported at a point in time.
 RECIST v1.1 is the standard way to measure the response of a tumor to treatment. Each response is defined by the change in tumor size, compared to baseline.
| RECIST v1.1 | |
| Complete Response (CR) | 100% decrease |
| Partial Response (PR) | ≥ 30% decrease |
| Stable Disease (SD) | Between 20% increase and 30% decrease |
| Progressive Disease (PD) | ≥ 20% increase |
An objective response rate (ORR) includes both complete response (CR) and partial response (PR). While a disease control rate (DCR) includes complete response (CR), partial response (PR) and stable disease (SD).
ORR = CR+PR
DCR = CR+PR+SD
Most companies report ORR. Sometimes, when there are few CR and PR, a company will report a DCR. Keep in mind that DCR is a "trick" used to make the response rate seem “higher”.
Spider Plot
Spider plot graphics overcome the caveat with waterfall plots by showing the individual response of each patient over time.
In a spider plot, every subject is represented as a line that starts from the same point. Depending on whether there is an increase or decrease in tumor size, the lines then are plotted according to the change. This way the % change from baseline for each subject is plotted across the entire study duration.

Swimmer Plot
Swimmer plots help to graphically analyze how long the responses last for the subjects.
A swimmer plot has horizontal bars representing each subject that has experienced a response. Subjects that do not have a complete or partial response are not included in the plot. For each subject, the start of a response and the end of a response is depicted inside the bar.
For ongoing responses where the end is not known, the bar displays a right-angled arrow. Swimmer plots are used to identify duration of responses and if patients are still on treatment or have stopped dosing.

An important measure for oncology readouts is the duration of response (DOR). This is the time from the first documentation of response (partial or complete) to date of progression or death due to any cause. Longer durability is preferred as it shows the drug is effective without the need to be dosed multiple times, which can lead to greater toxicity and adverse events.
DOR= Progression/death date – Date of first CR or PR
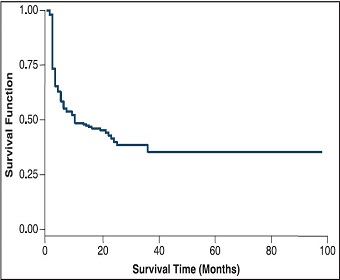
Kaplan-Meier Curve
Kaplan-Meier plot is the most popular tool for graphing survival analysis.
Overall survival (OS) is arguably the most important data point in later stage trials as it measures how long a treatment extends a patient’s life. Overall Survival is considered to be the “gold standard” among primary efficacy endpoints.
OS is the time from the start of treatment till the time of death.
OS = death date – start date

Progression-free survival (PFS) is the other gold standard endpoint in oncology, and can also be graphically represented with Kaplan-Meier curve. PFS is the time from the start of treatment to the first documentation of progression or death.
PFS = progression or death date – start date
Forest Plot
Forest plots are useful to do subgroup analyses or to view the results as a table and a graph together in one output. These graphs are generally used in non-inferiority trials whereby one drug tries to show that it is not 'inferior' to the previous one.
For every subgroup in the below graph, hazard ratio and confidence intervals are displayed in each line. A The hazard ratio is the probability of an event in a treatment group relative to the control group probability over a unit of time. The below example graph indicates that the results favor Treatment A over Treatment B.

It is important to remember that as stand-alone, each of the above plots are giving just a snapshot. Meaningful data interpretation needs multiple data sets and plots.
Access This Content Now
Sign Up Now!