We’ve broken down some near-term potential support levels for the S&P 500 to help readers get a sense of what we’re watching as the market chops. Given it’s the actionable proxy for the S&P, most traders reference the SPDR S&P 500 ETF (SPY) rather than the index itself, which we do here.
Our purpose: gauging areas at which we can get more comfortable putting money to work on the long side, and/or at which to cover short positions. Remember, technical analysis is only useful because a large number of market participants are looking at the exact same thing. We’re looking for trends, and obvious ones.
The S&P 500 has been in a defined trading range for a little over three years but has slipped meaningfully in the last month, now down almost 10% from all-time highs at 2019. On the chart below (a weekly chart of the SPY going all the way back to the 2009 crash), you can see the current channel, which began in mid-2011. On Wednesday after an immediate dump then rally in the morning, the SPY continued to slip and came quite close to the bottom of this trend before bouncing.
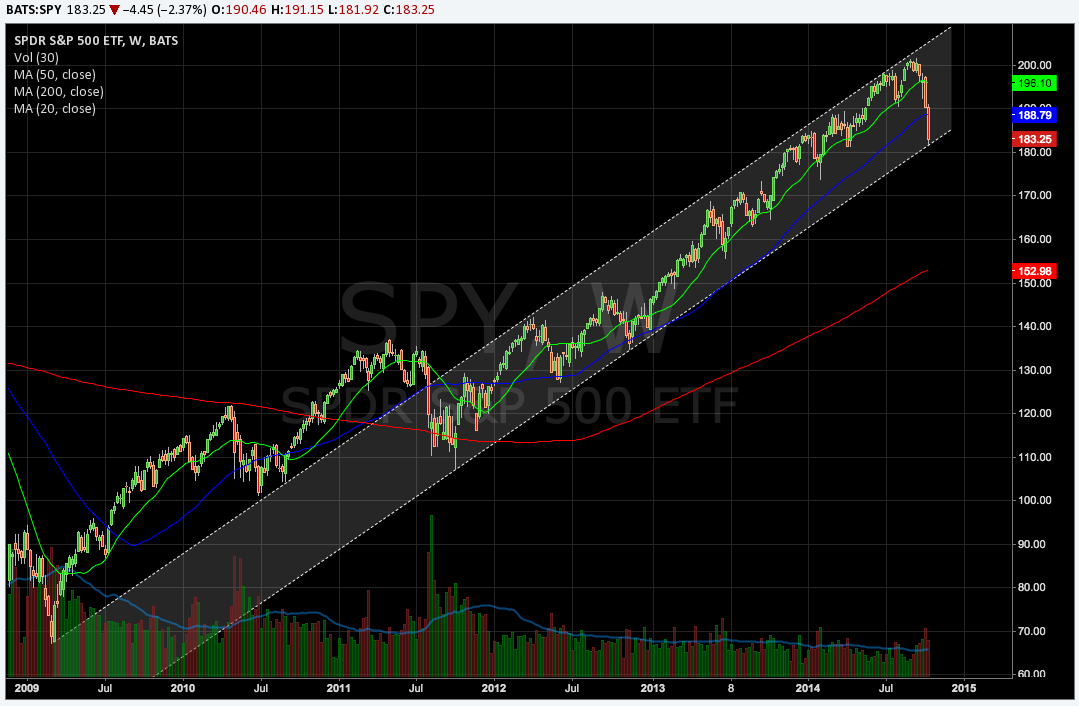
Note that the last time the SPY broke through its uptrend line in mid-2011, which then became resistance in the current channel, the market fell another 15% before finding support. The bottom of this trend is a great spot to eyeball for support – a confirmed break could mean a meaningful dip lower.
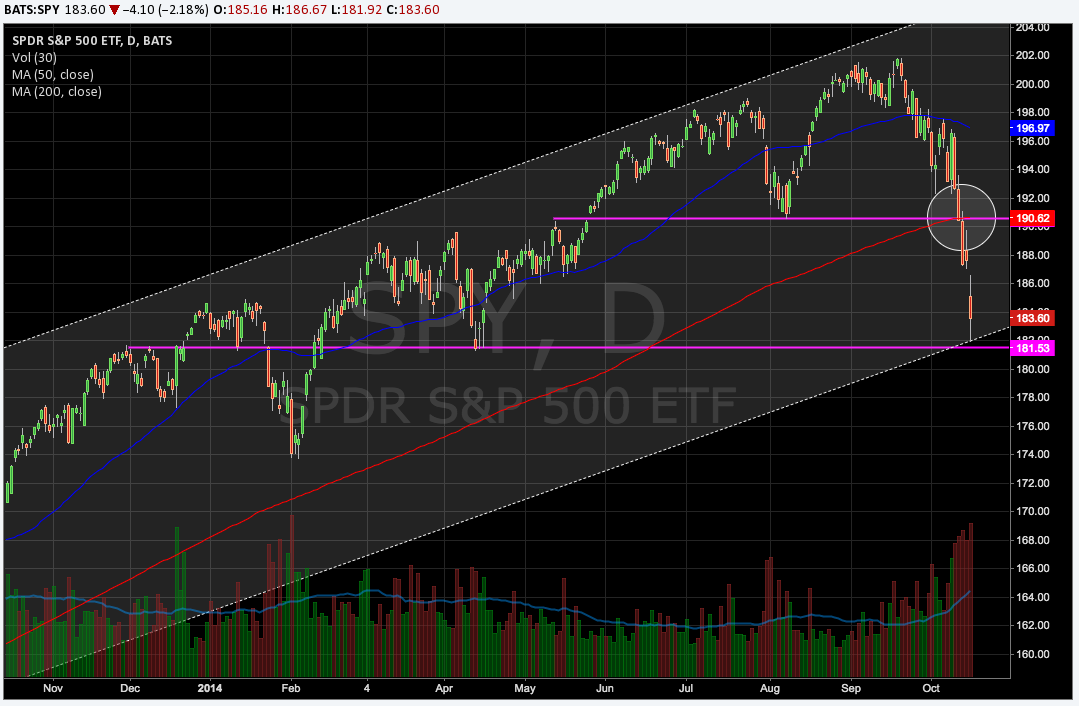
Last Friday, the SPY tested but held its 200-day Simple Moving Average at 190.50. This level also offered support in August when the market dipped, apparent in the daily chart below. On Monday, however, the SPY broke 190.5 before also claiming the SPY’s 50-Week Simple Moving Average (blue line in the chart above) at 188.9 on high volume as well. It’s good to keep an eye on both the daily and weekly timeframes.
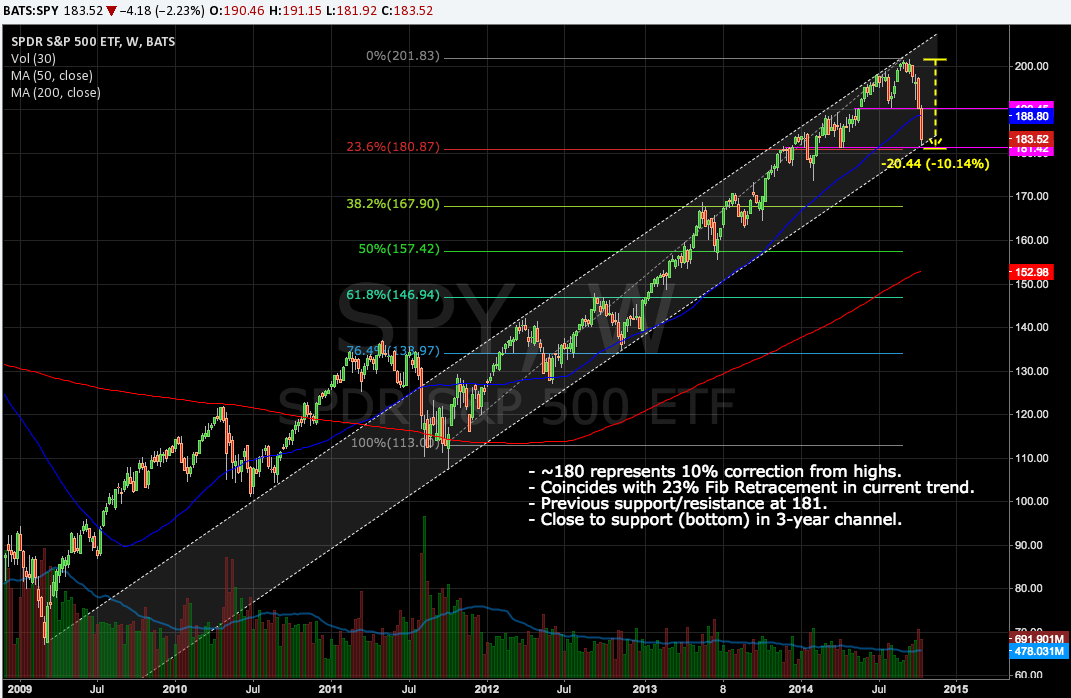
So why is 180 (1800 for the SPX) or thereabouts so interesting?
First, 180 is close to the bottom of the 3-year range mentioned above (again, see the grey channel in the chart).
Second, 181 represents a 10% correction from the SPY’s top. Although this is a somewhat arbitrary number, financial pundits the world over won’t consider this a true correction until we’ve reached this level. Right around 181 is a 10% decline from 202.
Third, many traders will be watching Fibonacci Retracement levels: 180 happens to coincide with a 23.6% retracement of the current uptrend. (Read more about the use of Fibonacci levels here.) Again, this is only relevant because traders widely use this indicator in retracement situations.
Finally, we’ve seen 181 act as resistance and support in the past: first in late 2013 as the market ticked higher and again as support in April of this year. This is the lower violet, horizontal ray in the charts above/below.
Not unexpected would be a bounce in the very near-term, if only temporary. The SPY and other indices are meaningfully oversold, and a relief rally after FIVE big down days in a row – with some clear panic selling in a few sessions – would not come as a surprise. In addition, traders will like the strength seen when the SPY bounced from the uptrend line on Wednesday.
The biggest question is whether a bounce would be an opportunity to reduce exposure before another trip lower, or a place to put more money to work on the long side. We lean towards the former, and continue to think that having cash free right now is preferable to equity over-exposure. Our focus in biotech at the moment: well-defined strategies into upcoming binary events, with capital free for opportunistic value buying. One name we’ve been stalking for months is Bluebird Bio (BLUE). The stock has held up incredibly well in the last month despite heavy small-cap selling all around, which exemplifies that investors are still willing to pay for quality. This week BLUE dipped below $34.00, the company’s last financing price, and even as low as $29. We suggest putting this on a watchlist if not already, as we plan to follow up with more research in the near-term.
For now, 1800 or so remains an interesting point to watch on the SPY. Note that Wednesday was the biggest volume day in the last year, and the SPY is on track to close awfully close to its open. Additionally, small-caps (and even biotech stocks) are showing some strength in the last two days. These were the first to go with this market dip; they may be the first to come back. Food for thought.
One or more of PropThink’s contributors are long BLUE or SPY.